Donut chart
The DonutChart class allows adding a donut chart (also known as a ring chart) to a presentation slide.
It automatically creates a group of shapes including slices and total value label, and calculates angles and layout based on the input data.
- class pptx_shapes.charts.donut.DonutChart(config: DonutChartConfig)
- render(data: List[dict], x: float, y: float) List[Shape]
Configuration
The appearance and layout of a donut chart can be customized using the following configuration dataclasses:
GapConfig
- class pptx_shapes.charts.donut.config.GapConfig(thickness: float = 1, color: str = '#ffffff')
Controls the spacing between adjacent slices of the donut.
Attributes:
thickness(float) — the thickness of the gap between slices, in pt units, default:1.color(str) — the fill color of the gap area, default:white.
Example:
gap = GapConfig(
    thickness=0.5,
    color="#000000"
)
LabelConfig
- class pptx_shapes.charts.donut.config.LabelConfig(size: int = 20, color: str = '#222222', family: str = 'Calibri', bold: bool = True)
Defines the style of the central text label that displays the total sum value inside the donut chart.
Attributes:
size` (`int`) — font size of the central label. Default: ``20.color(str) — text color, default:"#222222".family(str) — font family used for the central label, default:"Calibri".bold(bool) — whether the central label is rendered in bold, default:True.
Example:
label = LabelConfig(
    size=24,
    color="#333",
    family="Arial",
    bold=False
)
DonutChartConfig
- class pptx_shapes.charts.donut.config.DonutChartConfig(inner_radius: float = 3, outer_radius: float = 5, start_angle: float = 90, gap: Optional[pptx_shapes.charts.donut.config.GapConfig] = <factory>, label: Optional[pptx_shapes.charts.donut.config.LabelConfig] = <factory>)
Main configuration object for the donut chart. Includes geometric settings and optional gap/label configuration.
Attributes:
inner_radius(float) — radius of the inner hole of the donut in centimeters, default:3.outer_radius(float) — radius of the outer circle of the donut, default:5.start_angle(float) — starting angle for the first slice (in degrees, clockwise from 3 o’clock), default:90.gap(Optional[GapConfig]) — configuration for slice spacing, default: instance ofGapConfig.label(Optional[LabelConfig]) — configuration for the central total sum label, default: instance ofLabelConfig.
Example usage
from pptx_shapes import Presentation
from pptx_shapes.charts.donut import DonutChart, DonutChartConfig, GapConfig, LabelConfig
from pptx_shapes.shapes import Group
config = DonutChartConfig(
inner_radius=4.5,
outer_radius=7.5,
gap=GapConfig(thickness=3, color="#fff"),
label=LabelConfig(size=100, color="#222")
)
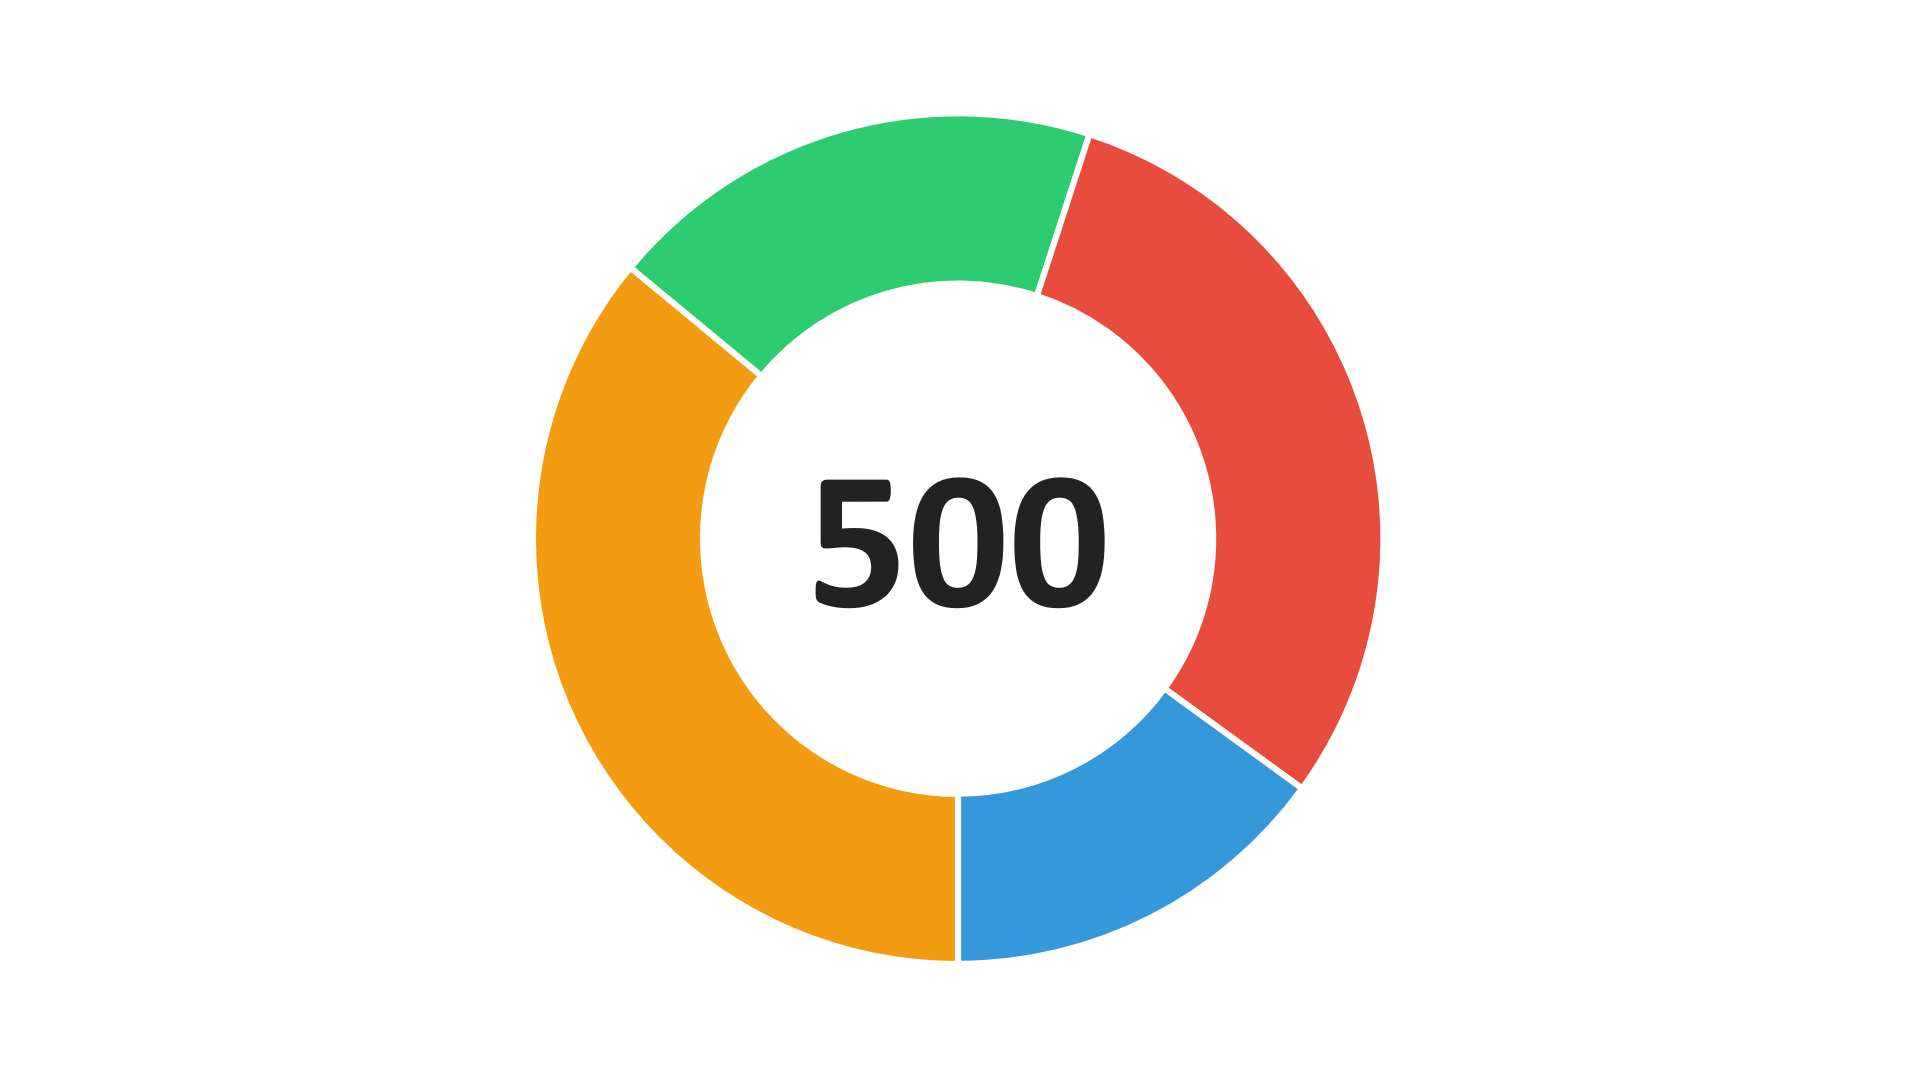
data = [
{"value": 180, "color": "#f39c12"},
{"value": 95, "color": "#2ecc71"},
{"value": 150, "color": "#e74c3c"},
{"value": 75, "color": "#3498db"}
]
with Presentation(presentation_path="empty.pptx") as presentation:
chart = DonutChart(config=config)
presentation.add(shape=Group(chart.render(data=data, x=9.4, y=2)))
presentation.save("donut_chart.pptx")