Polygons split example
This example demonstrates how to create a dynamic tiling of polygons on a PowerPoint slide.
It uses the Polygon and Group shapes,
as well as FillStyle and StrokeStyle from the pptx_shapes library.
The script defines an iterative polygon-splitting algorithm. Starting with a single square, it repeatedly splits polygons using lines and adds the result as groups of colored polygons to a slide.
Overview
Start from a single square polygon
Iteratively split polygons using defined lines
Assign new colors to sub-polygons after each split
Map logical coordinates to slide coordinates
Add results as grouped shapes to the slide
Example Code
  1from typing import List, Tuple
  2
  3from pptx_shapes import Presentation
  4from pptx_shapes.shapes import Group, Polygon
  5from pptx_shapes.style import FillStyle, StrokeStyle
  6
  7
  8def split_polygon(polygon: List[Tuple[float, float]], line: Tuple[float, float, float]) -> Tuple[List[Tuple[float, float]], List[Tuple[float, float]]]:
  9    polygon1, polygon2 = [], []
 10    a, b, c = line
 11
 12    for i, (x1, y1) in enumerate(polygon):
 13        x2, y2 = polygon[(i + 1) % len(polygon)]
 14
 15        sign1 = a * x1 + b * y1 + c
 16        sign2 = a * x2 + b * y2 + c
 17
 18        if sign1 <= 0:
 19            polygon1.append((x1, y1))
 20
 21        if sign1 >= 0:
 22            polygon2.append((x1, y1))
 23
 24        if sign1 * sign2 >= 0:
 25            continue
 26
 27        t = sign1 / (sign1 - sign2)
 28        x = x1 + t * (x2 - x1)
 29        y = y1 + t * (y2 - y1)
 30
 31        polygon1.append((x, y))
 32        polygon2.append((x, y))
 33
 34    return polygon1, polygon2
 35
 36
 37def mix_colors(color1: str, color2: str) -> str:
 38    r1, g1, b1 = color1[1:3], color1[3:5], color1[5:]
 39    r2, g2, b2 = color2[1:3], color2[3:5], color2[5:]
 40
 41    r = (int(r1, 16) + int(r2, 16)) // 2
 42    g = (int(g1, 16) + int(g2, 16)) // 2
 43    b = (int(b1, 16) + int(b2, 16)) // 2
 44
 45    return f"#{r:02X}{g:02X}{b:02X}"
 46
 47
 48def split_polygons(polygons: List[dict], line: Tuple[float, float, float]) -> List[dict]:
 49    new_polygons = []
 50
 51    for polygon in polygons:
 52        polygon1, polygon2 = split_polygon(polygon=polygon["points"], line=line)
 53
 54        if len(polygon1) > 2:
 55            new_polygons.append({"points": polygon1, "color": mix_colors(polygon["color"], "#dd7373")})
 56
 57        if len(polygon2) > 2:
 58            new_polygons.append({"points": polygon2, "color": mix_colors(polygon["color"], "#7699d4")})
 59
 60    return new_polygons
 61
 62
 63def view_points(points: List[Tuple[float, float]], limits: dict, x0: float, y0: float, width: float, height: float) -> List[Tuple[float, float]]:
 64    mapped_points = []
 65
 66    for x, y in points:
 67        x = x0 + (x - limits["x_min"]) / (limits["x_max"] - limits["x_min"]) * width
 68        y = y0 + (limits["y_max"] - y) / (limits["y_max"] - limits["y_min"]) * height
 69        mapped_points.append((x, y))
 70
 71    return mapped_points
 72
 73
 74def main() -> None:
 75    lines = [
 76        (0.04, 0.3, -0.01),
 77        (-0.75, 0.1, -0.97),
 78        (-0.14, 0.9, 0.96),
 79        (1.14, 0.18, -1.05),
 80        (1.27, -0.07, 0.04),
 81        (-0.2, 0.24, -0.15),
 82        (0.35, 1.34, -0.96),
 83        (0.26, -0.9, -0.54)
 84    ]
 85
 86    limits = {"x_min": -1.7, "y_min": -1.7, "x_max": 1.7, "y_max": 1.7}
 87    polygons = [
 88        {"points": [(-1.7, -1.7), (-1.7, 1.7), (1.7, 1.7), (1.7, -1.7)], "color": "#ffffff"}
 89    ]
 90
 91    x0, y0 = 1, 1.5
 92    size = 7.5
 93    gap = 0.5
 94    columns = 4
 95
 96    with Presentation(presentation_path="empty.pptx") as presentation:
 97        for i, line in enumerate(lines):
 98            polygons = split_polygons(polygons=polygons, line=line)
 99            x = x0 + (size + gap) * (i % columns)
100            y = y0 + (size + gap) * (i // columns)
101
102            shapes = []
103            for polygon in polygons:
104                points = view_points(points=polygon["points"], limits=limits, x0=x, y0=y, width=size, height=size)
105                shapes.append(Polygon(points=points, fill=FillStyle(color=polygon["color"]), stroke=StrokeStyle(color="#222", thickness=0.5)))
106
107            presentation.add(shape=Group(shapes=shapes))
108
109        presentation.save("polygons.pptx")
110
111
112if __name__ == "__main__":
113    main()
Result
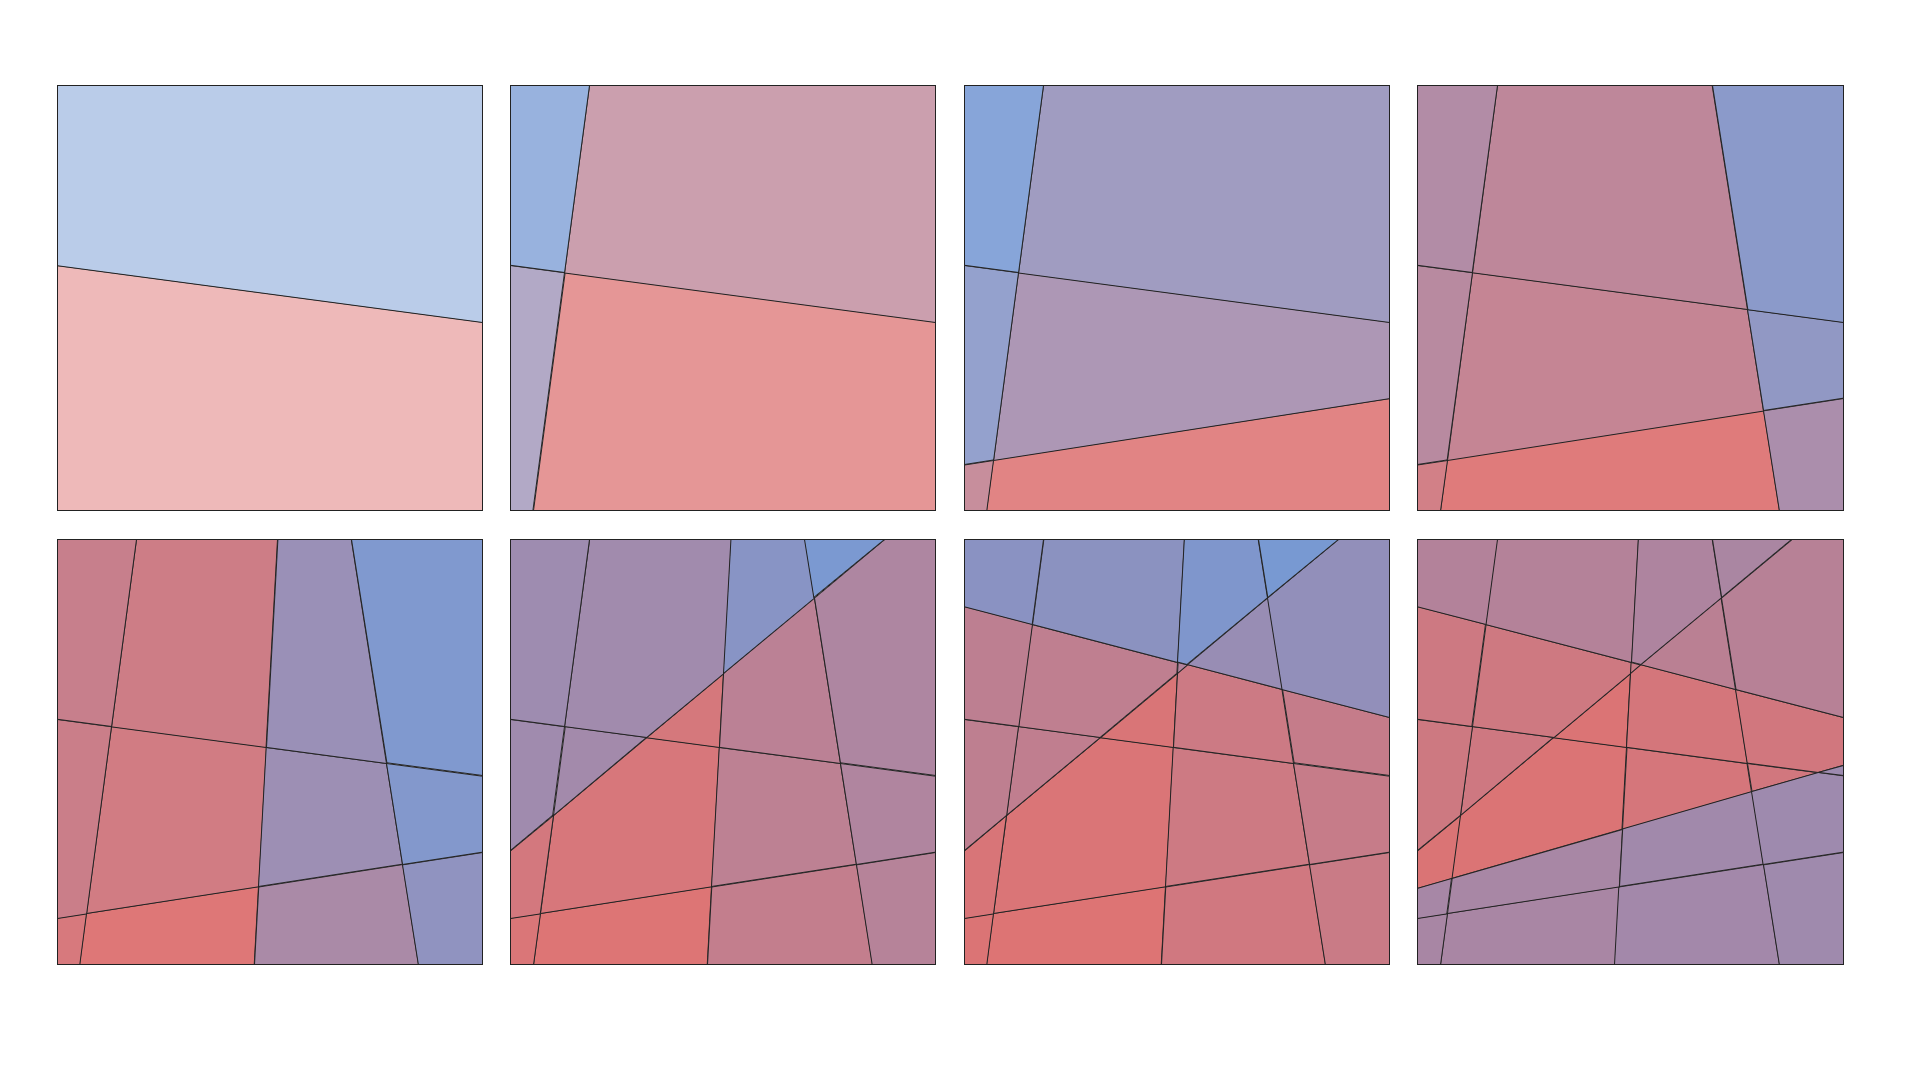
This example produces a grid of polygon patterns, each illustrating the effect of applying a new splitting line.
Each shape is created using:
Polygon – to represent each polygon
Group – to group multiple polygons as one object
FillStyle and StrokeStyle – for styling the fill and stroke
Note
Logical coordinates are automatically transformed to slide coordinates using the provided limits and size parameters.
Output file: polygons.pptx