Basic example
This example demonstrates a variety of shape types, styling options, and layout techniques supported by pptx-shapes.
Overview
The script:
Opens a base PowerPoint file with one empty slide (
empty.pptx)Adds shapes such as
TextBox,Ellipse,Arrow,Arc,Rectangle,Polygon, andGroupDemonstrates: - Filled and outlined shapes - Text with styling and rotation - Groups of multiple elements - Use of coordinates, angles, and alignment - Color and opacity settings
Key features illustrated
Text and formatting: bold, size, color, alignment, rotation
Stroke styles: thickness, dashed lines, opacity
Fill styles: colors including hex, named, opacity
Shapes: rectangles (rounded or not), ellipses, arcs, arrows, polygons
Groups: reusable composite structures (e.g., labeled triangle, histogram)
Alignment and layout: both manual coordinates and automatic
auto_fit
Example code
 1from pptx_shapes import Presentation
 2from pptx_shapes.enums import Align, ArrowType, LineDash, VerticalAlign
 3from pptx_shapes.shapes import Arc, Arrow, Ellipse, Group, Line, Polygon, Rectangle, TextBox
 4from pptx_shapes.style import FillStyle, FontFormat, FontStyle, StrokeStyle
 5
 6
 7def main() -> None:
 8    with Presentation(presentation_path="empty.pptx") as presentation:
 9        presentation.add(shape=TextBox(
10            x=23, y=4, width=12, height=2, text="Hello from pptx-shapes!", angle=45, style=FontStyle(size=32), formatting=FontFormat(bold=True)
11        ))
12
13        presentation.add(shape=TextBox(
14            x=7.5, y=17.2, width=18.5, height=1.5,
15            text="Python library for adding basic geometric shapes directly to PowerPoint (.pptx) slides by editing the XML structure.",
16            style=FontStyle(size=16, align=Align.LEFT),
17            auto_fit=True
18        ))
19
20        # ellipses
21        presentation.add(shape=Ellipse(x=20, y=2, width=4, height=4, fill=FillStyle(color="#7699d4")))
22
23        # arrows
24        presentation.add(shape=Arrow(x1=10, y1=9, x2=14, y2=11, start_type=ArrowType.OVAL, end_type=ArrowType.ARROW, stroke=StrokeStyle(thickness=2)))
25
26        # arcs
27        presentation.add(shape=Arc(
28            x=24, y=9, width=5, height=8, start_angle=90, end_angle=270, angle=45, stroke=StrokeStyle(color="#f00", thickness=2.5, dash=LineDash.DASH_DOTTED)
29        ))
30        presentation.add(shape=Arc(
31            x=19.5, y=1.5, width=5, height=5, start_angle=5, end_angle=175, stroke=StrokeStyle(color="#7699d4", thickness=2, dash=LineDash.DOTTED)
32        ))
33        presentation.add(shape=Arc(
34            x=19.5, y=1.5, width=5, height=5, start_angle=185, end_angle=355, stroke=StrokeStyle(color="#7699d4", thickness=2, dash=LineDash.DASHED)
35        ))
36
37        # rectangles
38        presentation.add(shape=Rectangle(
39            x=18, y=8, width=4, height=8.5, radius=0.25, fill=FillStyle(color="#dd7373"), stroke=StrokeStyle(color="#222", thickness=3), angle=30
40        ))
41        presentation.add(shape=Rectangle(
42            x=27, y=14, width=3, height=3, radius=0, fill=FillStyle(color="#dd7373"), stroke=StrokeStyle(color="#222", thickness=1)
43        ))
44
45        # polygons
46        presentation.add(shape=Polygon(
47            points=[(11, 12), (13, 14), (11, 16), (9, 14), (11, 12)], fill=FillStyle(color="yellow"), stroke=StrokeStyle(color="magenta", thickness=2.5)
48        ))
49        presentation.add(shape=Polygon(
50            points=[(15, 5), (16, 6), (15, 7), (12, 7), (11, 6), (12, 5)], angle=45, fill=FillStyle(color="#88ff88")
51        ))
52
53        # groups
54        presentation.add(shape=Group(shapes=[
55            Line(x1=1, y1=1, x2=13, y2=1, stroke=StrokeStyle(thickness=2, color="#7699d4")),
56            Line(x1=1, y1=1, x2=1, y2=6, stroke=StrokeStyle(thickness=2, color="#dd7373")),
57            Line(x1=13, y1=1, x2=1, y2=6, stroke=StrokeStyle(thickness=2, color="#89dd73")),
58            TextBox(x=0.7, y=3.5, width=13, height=1, text="hypotenuse", angle=-22.6, style=FontStyle(size=18, color="#89dd73", vertical_align=VerticalAlign.TOP)),
59            TextBox(x=-2, y=3, width=5, height=1, text="kathete", angle=90, style=FontStyle(size=18, color="#dd7373", vertical_align=VerticalAlign.TOP)),
60            TextBox(x=1, y=0, width=12, height=1, text="kathete", style=FontStyle(size=18, color="#7699d4", vertical_align=VerticalAlign.BOTTOM))
61        ]))
62
63        presentation.add(shape=Group(shapes=[
64            Ellipse(x=4.5, y=6.0, width=2.0, height=3.5, fill=FillStyle(color="#dd7373", opacity=0.5), stroke=StrokeStyle(color="black", thickness=2, opacity=0.75)),
65            Ellipse(x=3.0, y=8.5, width=3.5, height=2.0, fill=FillStyle(color="#dd7373", opacity=0.25), stroke=StrokeStyle(color="black", opacity=0.25), angle=-45),
66            Ellipse(x=5.0, y=8.5, width=3.5, height=2.0, fill=FillStyle(color="#dd7373", opacity=0.85), stroke=StrokeStyle(color="black", opacity=0.85), angle=45)
67        ]))
68
69        presentation.add(shape=Group(shapes=[
70            TextBox(x=1, y=15, width=4.8, height=1, text="little histogram", style=FontStyle(size=20, color="#7699d4")),
71            Rectangle(x=1, y=16, width=1.2, height=2.7, radius=0.2, fill=FillStyle(color="#7699d4"), stroke=StrokeStyle(color="#fff")),
72            Rectangle(x=2.2, y=16.4, width=1.2, height=2.3, radius=0.2, fill=FillStyle(color="#7699d4"), stroke=StrokeStyle(color="#fff")),
73            Rectangle(x=3.4, y=17, width=1.2, height=1.7, radius=0.2, fill=FillStyle(color="#7699d4"), stroke=StrokeStyle(color="#fff")),
74            Rectangle(x=4.6, y=16.1, width=1.2, height=2.6, radius=0.2, fill=FillStyle(color="#7699d4"), stroke=StrokeStyle(color="#fff"))
75        ]))
76
77        presentation.save("basic.pptx")
78
79
80if __name__ == "__main__":
81    main()
Output
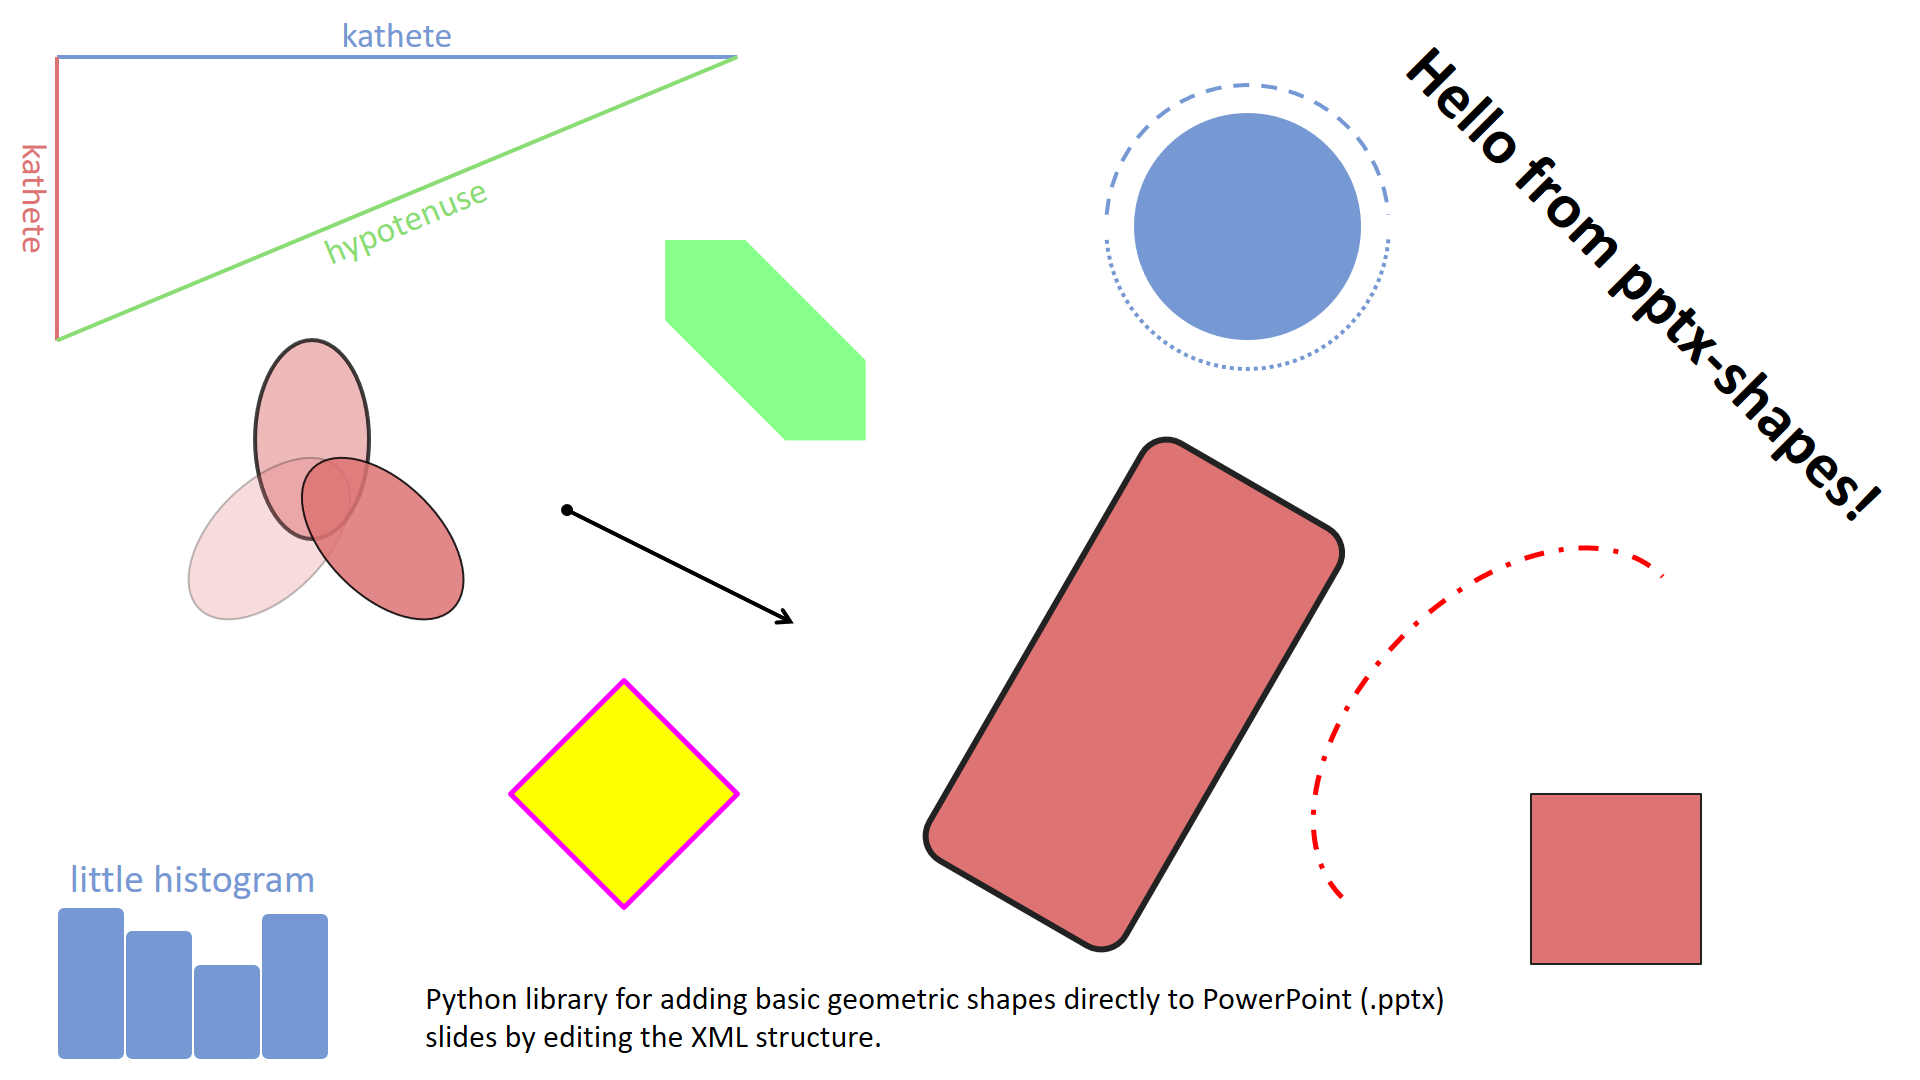
The script generates a file basic.pptx with all the illustrated shapes. Below is a preview of what it might contain:
A diagonal “Hello from pptx-shapes!” textbox
Ellipses with fills and stroke transparency
Colored and dashed arcs
Classic arrows with arrowheads
Rotated and grouped shapes with styled text
Custom polygons with fill and outline
A small histogram composed of styled rectangles
Note
This example assumes you have an empty.pptx file to use as a base presentation template.